Hive management that works at the hive.

Apiary HQ is an offline-first app for inspections, Varroa and small hive beetle tracking, and in-hive climate monitoring. It is built by a working beekeeper in Alabama.

Invite-only beta. Free while in beta.

In-hive and outside temperature over 72 hours Line chart for September 2 to 5, 2026. In-hive temperature stays between about 90 and 98 degrees Fahrenheit, mostly inside a shaded 93 to 97 degree reference band. Outside air swings between about 70 and 97 degrees. On the final night the hive is about 18 degrees warmer than outside. 65° 70° 75° 80° 85° 90° 95° 100° Wed Sep 2 Thu Sep 3 Fri Sep 4 Sat Sep 5 18°F warmer inside In-hive Outside Brood-nest reference 93–97°F In-hive and outside temperature over 72 hours Line chart for September 2 to 5, 2026. In-hive temperature stays between about 90 and 98 degrees Fahrenheit, mostly inside a shaded 93 to 97 degree reference band. Outside air swings between about 70 and 97 degrees. On the final night the hive is about 18 degrees warmer than outside. 70° 80° 90° 100° Sep 2 Sep 3 Sep 4 Sep 5 18°F
One hive in Cherokee County, Alabama, September 2 to 5, 2026. In-hive readings come from a wireless sensor, shown as 15-minute averages. Outside air is from a regional weather feed. Overnight the hive stayed above 90°F while outside air fell to the low 70s. The shaded band is a brood-nest reference range, a monitoring reference rather than a diagnostic threshold.

Records, scoring and climate in one app

Everything a beekeeper writes down, checks or worries about across a season, kept together and tied to the hive it belongs to.

Inspections
Record by voice or by tapping through a structured form. Frame-by-frame box maps capture brood, stores and queen status, and each visit starts from the last one so you are not rebuilding the hive from scratch.
Hive health scores
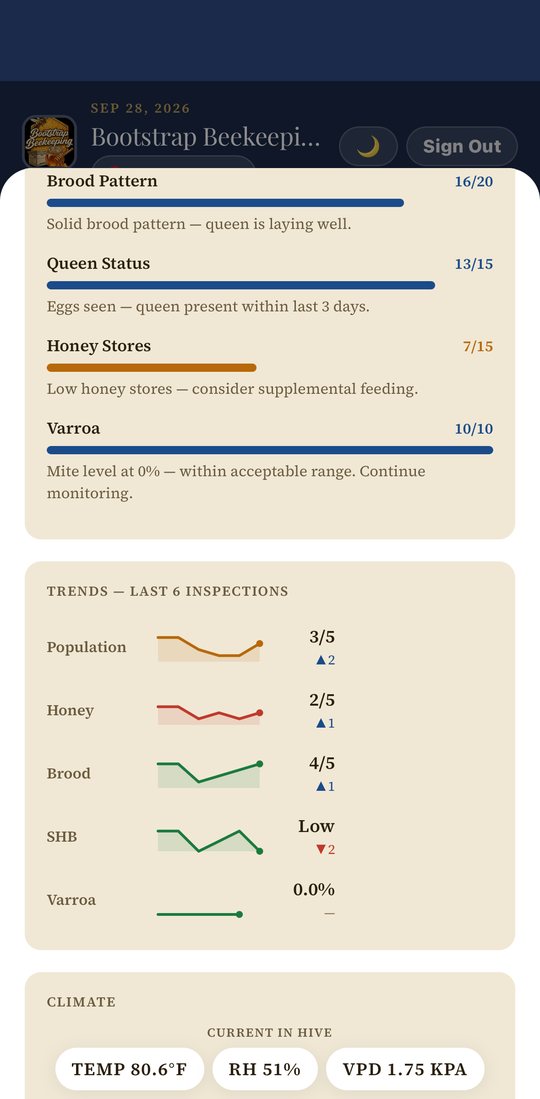
Each hive gets a score out of 100 with the factors laid out: inspection recency, population, brood pattern, queen status, honey stores and Varroa. Trends across recent inspections show which way each factor is moving.
Varroa and treatment
Log alcohol washes and get treatment recommendations based on the colony's phase, following the current Honey Bee Health Coalition guidelines. Treatment history and chemical rotation are tracked so rotation guidance shows up before you treat.
Small hive beetle
A risk index weighs colony strength, brood trend, exposed resources and queen status, and recommends a recheck interval. Larvae or slime shorten it to two days.
Climate monitoring
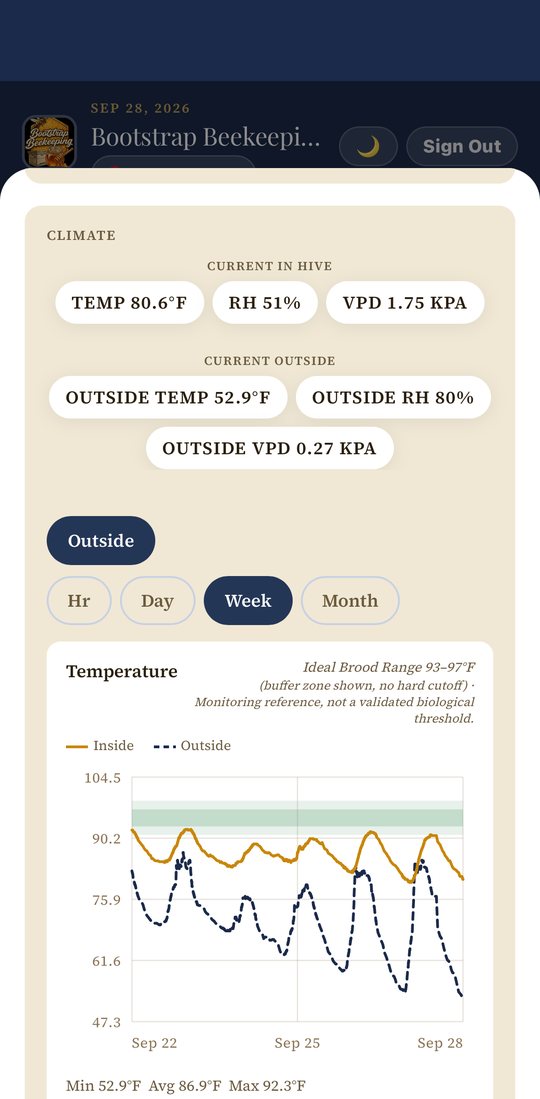
Connect a wireless sensor in the hive and another outdoors. The app charts temperature, humidity and vapor-pressure deficit for the hive and the air outside, and sends a push alert if a sensor stops reporting fresh data.
Reminders that fit your zone
Reminders follow your USDA hardiness zone and each hive's own history: wash windows, feeding checks, recheck intervals and treatment reapplication. The dashboard adds local weather, a fly score and a pollen and foraging forecast.
Works without signal
Install it to your home screen on iPhone or Android. Inspections recorded offline sync when you reconnect.
Your records
Export inspection reports as PDF or CSV. Expenses and receipt photos sit alongside hive records, and marking a hive lost keeps its history intact.

What it looks like

Captured on a phone, from a working apiary.
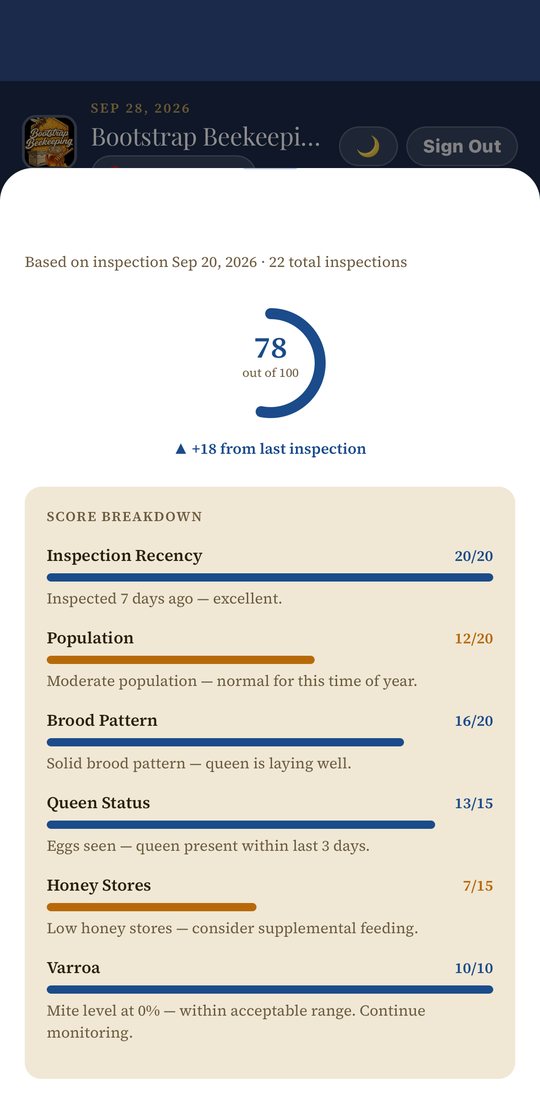
Health report for a hive showing a score of 78 out of 100, up 18 from the last inspection, with a breakdown by inspection recency, population, brood pattern, queen status, honey stores and Varroa.
A health score that shows its workEvery factor behind the number is listed, with a plain-language note on each.
Trend lines for population, honey stores, brood, small hive beetle and Varroa across the last six inspections, above the start of the climate panel.
Trends across recent inspectionsSee which way population, stores, brood, beetles and mites are moving.
Climate panel with current in-hive and outside readings and a week-long temperature chart with a shaded brood-nest reference band and a note that it is a monitoring reference, not a validated threshold.
Reference zones with their limits statedCharts show a buffer zone rather than a hard cutoff, and note where the science is unsettled.
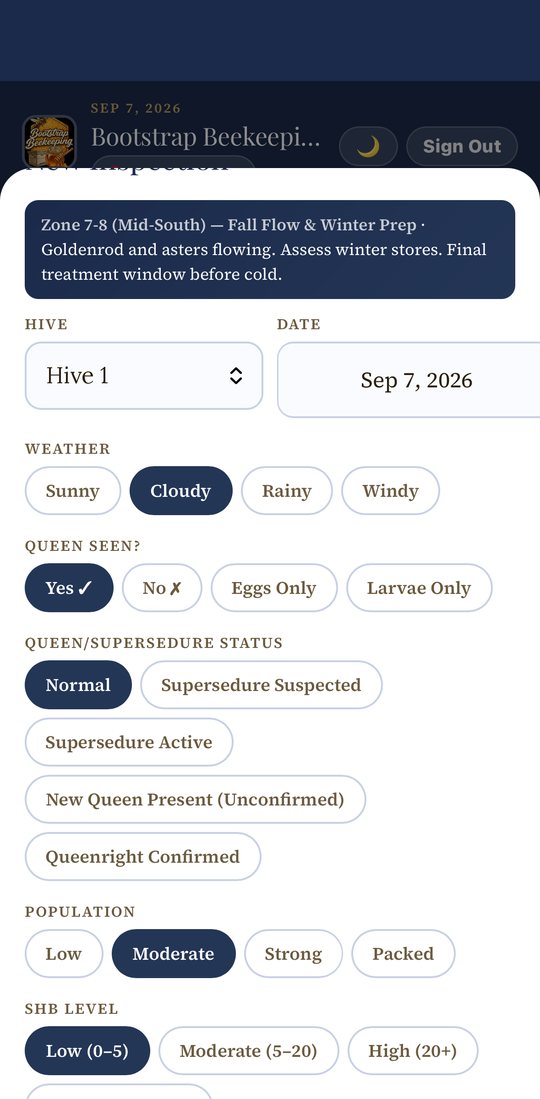
The inspection form with tap-to-select options for queen status, brood pattern, population, temperament and small hive beetle level.
Structured inspections, fast to fill inTap-to-select fields for queen status, brood, population and beetle level, with voice dictation for notes.

Decision support, not diagnosis.

Apiary HQ turns your records into prompts to look closer, and shows the inputs behind each one. A health score lists its factors. A reminder says why it fired. Varroa recommendations name the colony phase they are based on.

Where published guidance exists, the app follows it. Varroa recommendations are based on the current Honey Bee Health Coalition guidelines, and the climate reference ranges are consistent with published research on brood-nest temperature.

The app offers recommendations, not hard lines. The brood-nest band on the climate chart is labeled a monitoring reference, vapor-pressure deficit is shown against a buffer zone with no cutoff, and practical tools such as the beetle risk index are aids to judgment, not validated models.

Request an invite

Apiary HQ is in an invite-only beta with a small group of beekeepers. Email us and we will reply with an invite code.

Questions: [email protected]